Tableau Report for Real-Time Weather Insights Through Web Data Connector
A Europe-based logistic company wanted to add a feature to their website where visitors could access weather data in the form of a report.
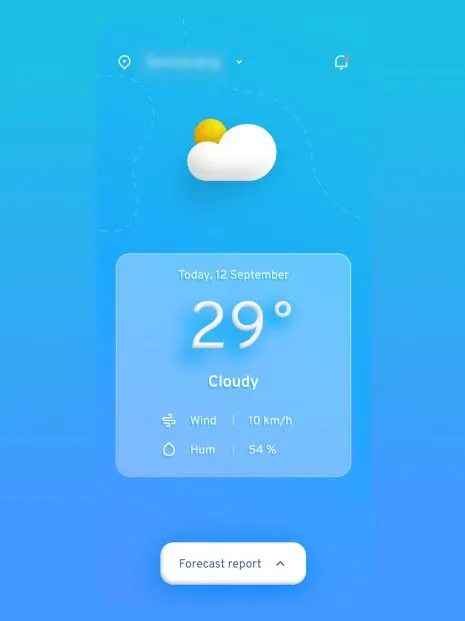
About the project
A Europe-based logistics company wanted to add a weather report to its website, so visitors could see weather data. The client set the parameters for the real-time weather insights: temperature, wind, precipitation, solar and cloud cover. The report also had to show details for multiple locations.
The Zehntech team used Tableau to create a data dashboard that met these needs. We developed a Web Data Connector (WDC) to fetch real-time data from the weather forecast website Open-meteo.com. Then we hosted the WDC file on Amazon Web Services (AWS). This created a connection link that fetches real-time data and passes it to the Tableau weather report continuously.
The challenge
The client wanted a weather insights report to show on its website. It planned to get data from the weather forecast organisation Open-meteo.com, which offers an open-source weather data API.
However, the Open Meteo API does not provide real-time data. So the client had to fetch real-time data by hand from the website, which took time and caused errors. To solve this, the client came to the Zehntech team. We fetch the real-time data and fill it into a Tableau dashboard.
What we built
- First, the team designed a WDC (Web Data Connector) in JavaScript to fetch weather data through the API from Open-meteo.com.
- The API offers a large amount of weather data, but the client wanted only a particular range of parameters and areas. So we customised the connector to select the required parameters.
- To fetch and show real-time data, we hosted the WDC file on an AWS server. From there, we got a connection link that automatically fetches real-time weather data from Open-meteo.com and shows it on the Tableau weather report.
- We designed a table in Tableau that shows the weather data for the quarter. It also compares the data with the same quarter of the previous year.
- We converted the hourly data into 6-hour intervals to show the average value. The solution also regularly retrieves and updates the weather data from the API.
- Users can easily share the reports with a custom link.
- Finally, we styled the table to look appealing, with formatting, alignments and colours.
See our custom software work for more.
A look at the work
The result for the client
Zehntech designed a Tableau dashboard that lets users extract real-time weather insights and make informed decisions. The dashboard shows data in a table that is easy to read and analyse. Users can also interact with the data by applying filters.
The official weather website’s API has greatly improved data access. Now the client can retrieve weather forecast data without manual collection or processing. The client was happy with this implementation, and website visitors have given positive feedback.
What we built it with



Related case studies
ZOHO CRM Implementation for a California-based Wealth Management Company
A California-based wealth management company working with high net-worth customers provides its customers with wealth generation advice.
15 Days · 80 HoursRead the case study →
Algramo: ZOHO CRM Implementation
Algramo is a Santiago-based social enterprise whose goal is to create a positive environmental impact by reducing the use of plastic.
15 Days · 50 HoursRead the case study →
Odoo 16 implementation for a furniture manufacturer
The business ran on Excel. Stock levels were guessed, orders had errors and manual accounts let money slip through.