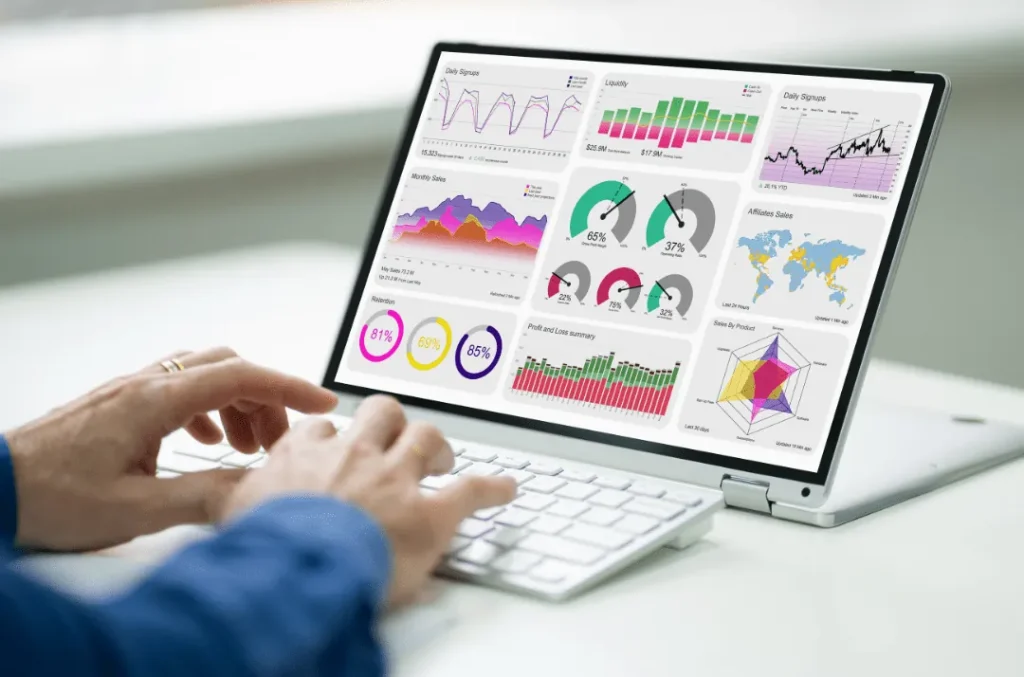
Is Tableau the right data visualization tool for your business? It is a quick-growing tool that data-driven businesses use every day. It turns raw data into a format that most people in a company can understand. Even non-technical users can build their own worksheets and dashboards with it. As a result, Tableau improves your data analytics skills across the whole team.
Types of Tableau tools: the right data visualization tool for each job
Tableau splits its tools into two groups. Both groups matter, because building and sharing are different jobs.
Developer tools: These help you build charts, reports and dashboards. There are two products here: Tableau Desktop and Tableau Public.
Sharing tools: These help you share the reports and dashboards you made with the developer tools. The products here are Tableau Online, Tableau Reader and Tableau Server.
Tableau products that businesses use most
Tableau offers many products, so you can pick the one that fits your needs.
Tableau Public: As the name suggests, the data you build here is saved to a public cloud that anyone can open. The aim is to share data with people, so the data does not need protection.
Tableau Desktop: It comes with many features. You can create reports and charts and combine them into a single dashboard. Because it connects to a data warehouse, Tableau Desktop helps you with real-time data analysis. You can also save data both publicly and locally. Tableau Desktop has two editions, based on publishing options.
Tableau Desktop Personal: It keeps all your work private, and you cannot publish it online. You share data offline or through Tableau Public.
Tableau Desktop Professional: You can publish data online on the Tableau server.
Tableau Server: After you publish your work from Tableau Desktop, you can share it through Tableau Server. Only permitted users can view the data published here. Security is high, so your data stays safe and confidential. Only the admin can change the data, which keeps it secure.
Tableau Online: It is quite similar to Tableau Server. However, the Tableau group itself maintains the cloud where your data is stored. One key advantage is that there is no limit on the data you can publish.
Tableau Reader: It lets you check the visualizations and workbooks that you created in Tableau Desktop and Public, for free. However, you can only do a limited amount of editing on your data. There is no security on the data. Anyone who has access to the workbook can see the data, but the viewer must have Tableau Reader to open the dashboard.
How does Tableau work for business?
After you buy a version of Tableau, you get several data connectors that link to any database. The number of connectors, however, depends on the version you buy.
You can then use this data live, or you can extract it to Tableau Desktop for analysts and visualizers to work with. Then, whoever receives the data can view it with Tableau Reader. You can also publish Tableau Desktop data on Tableau Server, so users can open these files.
Why Tableau is the right data visualization tool
- Real-time data analysis
- Import large-size of data
- Data Collaboration
- Business Intelligence
- Manage large-sized metadata
- Data Blending
- Create no-code data queries
- Data Visualization
Why Tableau is preferred over Excel
Both Tableau and Excel are popular tools for data analytics. However, each has its own set of features. Excel works only in rows and columns. With Tableau, you can drag and drop while you explore your Excel data. Tableau can also show your data as pictures, graphs and tables, which makes it easy for users to understand.
Conclusion
Even without a set goal in mind, Tableau data management can analyze data. First, it lets you explore the same data from a different point of view and add different components for analysis. Then, even people without technical skills can use Tableau quite easily. Its drag-and-drop feature makes every visualization simple to understand.
Tableau also lets you switch visualizations to present your analysis in new ways. That is why it is the right data visualization tool for many teams. You can even visualize unordered data in many ways and add many datasets. Also, it blends various data sources. Tableau connects all types of data and helps organizations build strong visualizations. Contact our team if you want help with your own data.
Have a question about this?
Book a 30-minute call with an engineer who works on it.