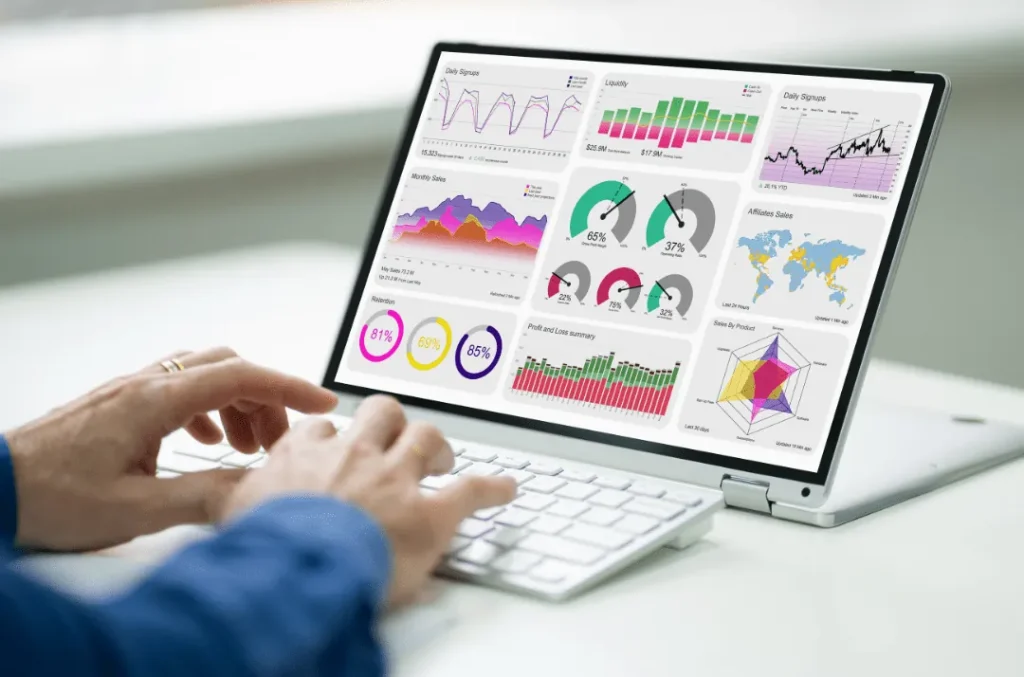
Tableau is a data visualization tool that the Business Intelligence industry widely uses. It offers simple visualizations that make raw data easier to understand. Therefore, professionals at all levels in an organization can understand their data more easily.
Moreover, you need no technical skills or coding knowledge to use Tableau. The tool has attracted interest from many sectors, including business, research, and other industries.
Why Should You Use This Tableau Data Visualization Tool?
Tableau connects to many sources and extracts data from them. Further, there is no limit to how many platforms it can draw data from. You can extract data from a spreadsheet, a PDF, an Oracle database, or a cloud database. Cloud options include AWS, Microsoft Azure SQL, and Google Cloud SQL.
These are only a few of the advantages Tableau gives its users. Below are the game-changing advantages that have changed how businesses work. They deliver seamless and top-notch data visualization.
The Ability To Experiment With New Features
Analysts often find it hard to experiment with new features. They are left guessing what is happening and what they are actually doing. Hence, any meaningful progress needs a lengthy research process.
With Tableau’s drag-and-drop functionality, your analysts can test new concepts, drill into interesting topics, and update quickly. Because they can explore and visualize dashboards rapidly, they get valuable information for the business. The intuitive interface lets analysts look for deeper meaning instead of dealing with technical details.
Moreover, analysts can add dimensions, add measurement filters, group values, and drill into outliers with a simple drag and drop. Advanced features such as clustering, trend analysis, and average lines also make it easy to find patterns in your data.
Further, business needs change quickly and often, so your report needs to adapt easily. With Tableau, you can develop reports easily and change elements as requirements change.
Finally, visualization helps you get insights faster and spot opportunities for improvement more easily. Tableau supports color-coding, clustering, and a wide range of chart types and encodings. This gives you a more complete dashboard experience.
Share Updated Dashboards
Typically, people send dashboards as PDFs by email, as static presentations. It is then hard to find another dashboard or an older version for comparison. The emails and files end up scattered in the inbox or on a computer.
With Tableau Server, you can host your company’s dashboards in one place. The tool shares dashboards with stakeholders automatically. Stakeholders can favorite views and add comments. You can also format dashboards in the browser whenever needed.
You can reach your company’s data sources right inside a Tableau dashboard. Tableau Server then keeps your dashboard updated with the most recent data. So, the dashboards run automatically, and you do not have to rebuild them each time.
Preparation Of Data Is Quicker and Easier
The most useful reports help stakeholders make timely and accurate decisions. A good report creator selects accurate information so that stakeholders can trust the results.
Collecting, preparing, and combining data by hand takes time and can cause errors. Tableau has built-in data connections, so you can format data quickly. The less time your analysts spend on data preparation, the more time they have to find insights.
Tableau supports many data sources, such as Excel, Microsoft Access, databases, and online services like Google Analytics and Salesforce.com. You can create a combined data source even when columns with the same name appear in multiple files. With so many connections, Tableau brings multiple sources of data together in one place. As a result, you get a centralized view instead of searching through separate reports.
The calculation builder in Tableau makes it fast for analysts to explore their data in new ways. You do not need IT or data engineering help to add new fields to every row. The friendly naming feature lets you create an arbitrary value without changing the underlying data. Whenever two data sources share a common field, Tableau links them together. These features help analysts run in-depth analyses.
Large amounts of data can be hard to manage in Excel. However, Tableau can bring in and analyze millions of rows without a row limit. You also need not worry about long processing times, because Tableau is designed for large amounts of data. As a result, you get a more complete picture of your organization without spending too many resources.
A Large Online Community And Consistent Improvement
The Tableau community consists of passionate people who want to share their knowledge. This is why Tableau keeps looking for new ways to meet the needs of its customers.
Conclusion
Data-driven businesses generate a great deal of data. However, success needs a thorough understanding of that data and how to process it. Tableau software can help your business turn a massive stream of data into actionable information. You may fall behind your competitors if you let data pass without further analysis. Therefore, data visualization with Tableau is important if your business wants to prosper. Read more on our blog.
Have a question about this?
Book a 30-minute call with an engineer who works on it.