
Zabbix 6.2 brings many features that improve the configuration and performance of Zabbix. It also makes the existing features more flexible and scalable. Zabbix announced two new releases in July, 6.2.0 and 6.2.1. Both are open source and free for non-commercial and commercial users, and both give you a distributed monitoring solution. Both releases focus on a better user experience for old and new features.
Zabbix 6.2.0 and 6.2.1 add several features. Here is a short list of each release.
New Features of Zabbix 6.2 in Releases 6.2.0 and 6.2.1
The new features for release 6.2.0
- Multiple LDAP sources
- AWS EC2 monitoring
- PHP version
- Digital clock widget
- Store your secrets secure in the CyberArk vault
- Reload Zabbix proxy configuration from the frontend
- Host and Template groups are separate
- Monitor active checks status from the Zabbix frontend
- Added VMware monitoring
The new features for release 6.2.1
- MariaDB Database max version 10.8 support
- Timescale DB 2.6 support
- Added new Templates
- Added new VMware items
MariaDB Database max version 10.8 support: Earlier versions of Zabbix supported MariaDB up to version 10.7. Now Zabbix 6.2.1 works with MariaDB up to 10.8.X, which gives the best performance in many production environments.
Timescale DB 2.6 support: With the latest release, we can use Timescale Database up to version 2.6.
Added new Templates: Release 6.2.1 adds a few new templates.
- HPE Synergy template by HTTP: The new HPF Synergy template is added for Synergy frames. It uses native Zabbix features and functions that don’t require external scripts or plugins.
- You can see the setup instructions HTTP Template. If you have the latest installation of 6.2.1, you can directly use it from the templates menu. If upgrading from the previous release, you can download the template from the official Zabbix Git repository Git repository. You can also find the new template on the template directory of the latest downloaded Zabbix version. You can import it manually from the Zabbix GUI.
- You can create a new Template from:
- The configuration → Templates
New VMware items: The new release introduces many items for VMware monitoring.
- VMware alarms monitoring: Before, we monitored VMware with a predefined Zabbix template. Now we can also create alarms for different VMware parts, like VMware cluster, datastore, HV and dc, with the items below.
The below list of the new items:
- vmware.alarms.get[]
- vmware.cluster.alarms.get[]
- vmware.datastore.alarms.get[]
- vmware.dc.alarms.get[]
- vmware.hv.alarms.get[]
- vmware.vm.alarms.get[]
- Collecting tag information from VMware: The new release adds many tags that collect tag information from different VMware components:
The below list of the new tags:
- vmware.cluster.tags.get[]
- vmware.datastore.tags.get[]
- vmware.dc.tags.get[]
- vmware.hv.tags.get[]
- vmware.vm.tags.get[]
- Return property values: The new release adds a number of return property values.
The below list of the new values:
- vmware.cluster.property[]
- vmware.datastore.property[]
- vmware.hv.property[]
- vmware.vm.property[]
Zabbix 6.2.0 Features in Detail
- Multiple LDAP sources: With the release 6.2.0, it is possible to define multiple servers simultaneously for LDAP authentication; several group users can authenticate from different LDAP servers. It also improves security compliance with company policies where other LDAP servers authenticate organizational units. It is required to configure the Zabbix server once, and then you can select the LDAP servers for the user groups from the user group tab.
- AWS EC2 monitoring: New template for AWS EC2 by HTTP is introduced. Using this template, you can quickly monitor your EC2 instances and attached EBS volumes. You can track EC2 instances in a single dashboard and monitor CPU, network, Status, and Disk. Also, you can monitor AWS EC2 alarms and react to alarm status.
- You can directly use it from the templates menu if you upgraded to the latest release from any old release. You can easily download the template from the official Zabbix Git repository and import it into Zabbix.
- PHP version: The new release raises the minimum PHP version from 7.2.5 to 7.4.0. As a result, Zabbix no longer supports versions below 7.4.0.
- Digital clock widget: Zabbix adds a new clock type for better visualization. In the previous releases, you could only select the Analog clock type. Now you can also set the Digital clock in the Zabbix Global view.
Set a digital clock in Zabbix 6.2
Follow the below steps to set a Digital clock type:
- First, go to the Monitoring → Dashboard
- Click on the setting icon from the right top corner of the Dashboard view.

- Then a new Edit widget window opens.
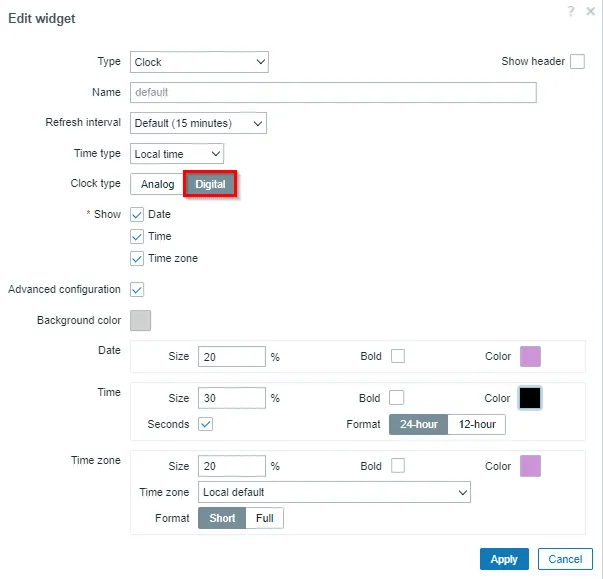
- You can fill in the fields as per your choice and select the Digital from the Clock type. You can also choose the color of the Digital Clock
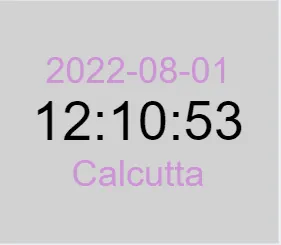
- Next, click the Apply button. Then you can see the Digital clock below.
CyberArk vault, proxy reload and separate groups
-
Store your secrets secure in CyberArk vault: In the previous releases, you could keep your information in the HashiCorp vault, but now it is possible to store your data more securely by using the CyberArk vault. It is mainly used for storing the user macros values and database access credentials. It is available in a readable form only.
You can select the CyberArk vault instead of the HashiCorp vault when configuring the DB connection during the installation. You can see the details information for the CyberArk configuration with the Zabbix. -
Reload Zabbix proxy configuration from the frontend: With the latest release, the Zabbix proxy instantly reloaded from the Zabbix GUI. Also, it is possible to refresh the central configuration for Active and passive proxies.
You can refresh the configured proxies with one click.
- Go to the Administration –> proxies
- Then a new proxy window opens, as the screenshot below shows.
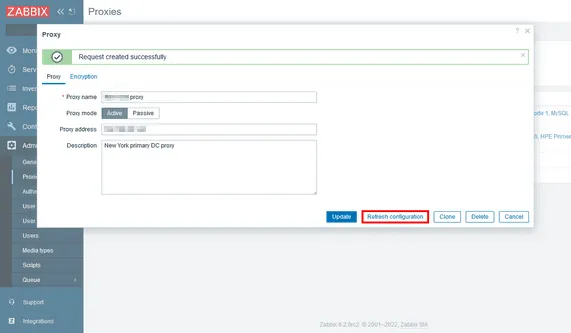
- Finally, click on Refresh configuration.
- You can also refresh the Zabbix proxy configuration from the Zabbix server via the command line and Zabbix API.
- One new feature is also added to request configuration for passive proxies from the Zabbix server using the config_cache_reload proxy runtime control command.
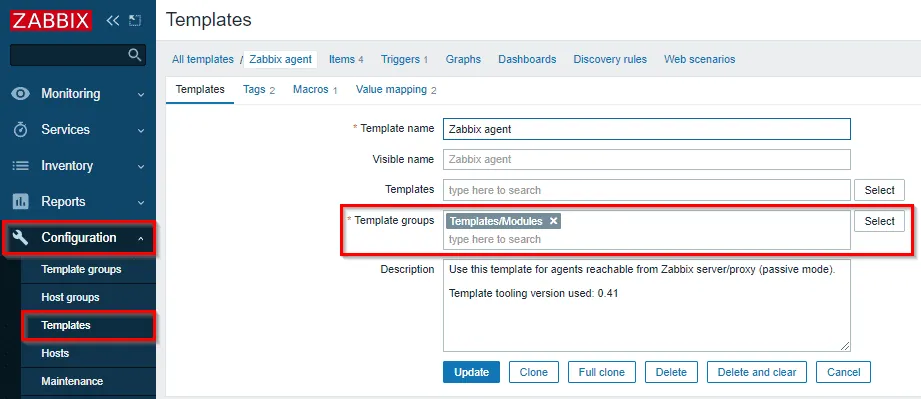
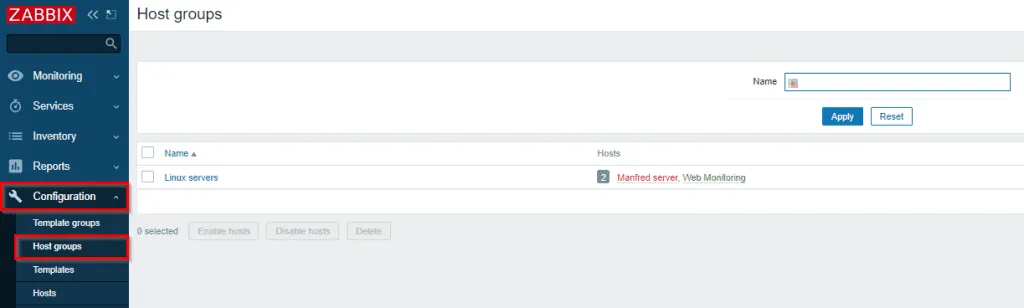
- Host and Template groups are separate: In the previous release, host groups are used to maintain both hosts and templates, but now this functionality has been separated. The template groups contain templates only, and the host groups contain hosts only. Now the User roles and User groups permissions are also separately defined for template and host groups.
If you upgrade to the latest release, the templates will automatically move into the Template groups.You can see the template groups from the below steps:
- Go to configuration → Template groups.
- Then you can see the list of Template groups below.
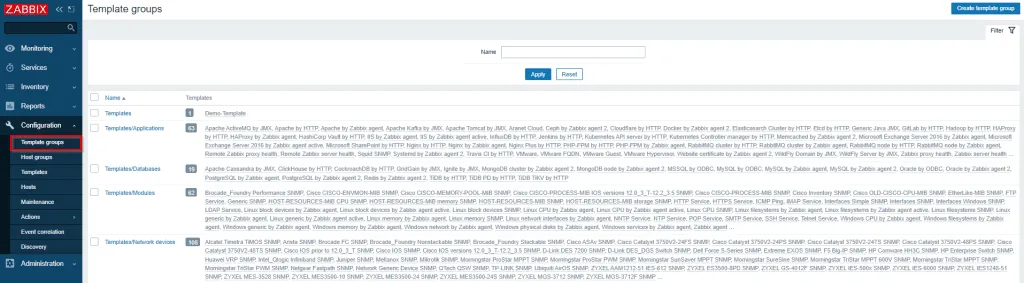
- Now you can select Template groups from Configuration → Templates. Then the menu opens a list of templates. As a result, you can select more than one template group as you need.
- Follow the below steps to see the host groups:
- Go to Configuration → Host groups
- You can see the below Host group.
Active checks status and VMware monitoring
- Monitor active checks status from the Zabbix frontend: You can now track the availability of the active and passive agent checks from the Zabbix GUI. The status of the active agent can also be checked through the Zabbix API.
Also, you can customize the Zabbix agent heartbeat period that is available in the agent configuration file. You can check it from the below steps:
- First, go to configuration → Hosts. There you can see the status of active checks in the Zabbix frontend.
- We can check the status of agent availability in the same way as the total availability of the passive agent:
- When the active check is available, and the passive agent is available –> overall availability shows in green color.
- When the active check is unavailable, and the passive agent is available –> overall availability shows in yellow.
- When the active check is unknown, and the passive agent is available –> overall availability shows in grey color.
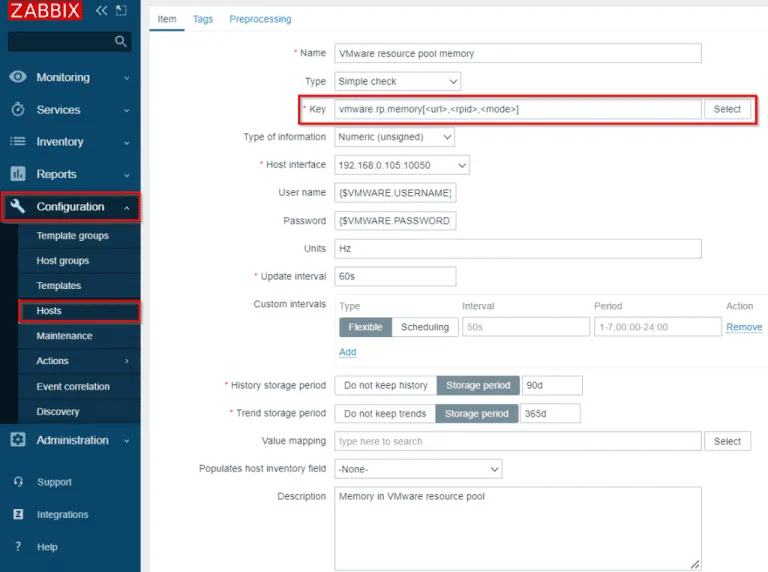
- Added VMware monitoring: VMware monitoring now works with new items. For example, you can check the alarm status and the VMware guest state. You can also check the timestamp of VMware snapshots and datastore performance counters.
You can manually assign templates for the discovered VMware hosts and can create other additional tags.
- vmware.dvswitch.discovery[]
- vmware.dvswitch.fetchports.get[]
- vmware.vm.state[]
- vmware.vm.tools[]
- vmware.hv.network.linkspeed[]
Follow the below steps to see the items of VMware:
- Go to configuration → Hosts
- Click on the Select option to open a list of items, and you can select items from the dropdown menu.
Conclusion
This article gives you details about the new and updated features of Zabbix 6.2.0 and 6.2.1. These features help you monitor your servers and network better. To go deeper, visit the official Zabbix site, or read more on the Zehntech blog.
Need help with your infrastructure?
We build and run custom systems on AWS, Azure and Docker.